In early 1970s 1 MB was costing 1 million $. Now 1 mb is costing fraction of that cost. There is no comparison. This is one of the reasons why engineers and enterprises dont worry about memory any more. 1 million $ in 1970s might be equivalent of several millions of dollars worth today. Thus, back in the days memory was treated so preciously. This preciousness has been vividly described in the book Idea Man autobiography of Paul Allen (Microsoft Co-founder). Paul Allen talks about the challenge he and Bill Gates faced in writing BASIC programming language (Microsofts very first product) under 4 KB.
There are 4 primary computing resources:
- CPU
- Memory
- Network
- Storage
Your application might be running on tens, thousands of application server instances. In above mentioned 4 computing resources, which resource does your application instance saturates first? Pause for a moment here, before reading further. Give a thought to figure out which resource gets saturated first.
For most applications it is *memory*. CPU is always at 30 60%. There is always abundant storage. Its hard to saturate network (unless your application is streaming video content). Thus, for most applications its the memory that is getting saturated first. Even though CPU, storage, network is underutilized, just because memory is getting saturated, you end up provisioning more and more application server instances increasing the computing cost of organizations to millions/billions dollars.
On the other hand, without exception modern applications wastes anywhere from 30 90% of memory due to inefficient programming practices. Below are 9 different practices that is followed in the industry, that is causing memory wastage:
- Duplicate Strings
- Inefficient Collections
- Duplicate Objects
- Duplicate arrays
- Inefficient arrays
- Objects waiting for finalization
- Boxed numbers
- Overhead caused by Object Headers
- Wrong memory size settings
If you can eliminate this 30 90% of memory wastage, it will bring 2 major advantages to your enterprise:
a. Reduce computing cost:
As memory is the first resource to get saturated, if you can reduce memory consumption, you would be able to run your application on a smaller number of server instances. You might be able to reduce 30 40% of servers. It means your management can reduce 30 40% of the datacenter (or cloud hosting provider) cost, maintenance and support cost. It can account for several millions/billions of dollars in cost savings.
b. Better customer experience:
If you are reducing number of objects that you are creating to service incoming request, your response time will get lot better. Since less objects are created, less CPU cycles will be spent in creating and garbage collecting them. Reduction in response time will give a lot better customer experience.
How much memory is my application wasting?
So now lets get back to original question of this article: How much memory is my application wasting?. Sad story is: there arent that many tools in the industry that can give you this answer. There are tools which can answer the question: How much memory is my application using? like TOP, Application Performance Monitoring (APM) tools, Nagios Using is different from Wasting. But we will help you answer this question. You just need to follow these 2 steps to get to this answer:
Step 1: Capture Heap Dumps
In order to analyze, how memory is wasted, you first need to capture the heap dump. Heap Dump is basically a snapshot of your applications memory. It has information what all are the objects that are present in memory, who is referencing it.
There are 7 options to capture heap dumps from your Java application. https://blog.heaphero.io/2017/10/13/...mps-7-options/
There are 3 options to capture heap dumps from android application. https://blog.heaphero.io/2018/06/04/...app-3-options/
You can use the option that is more suited for you.
Step 2: Analyze using HeapHero toolIts recommended to capture heap dump when your application is taking traffic. When application is idle, new objects will not be created, thus you wouldnt be able to see how much memory is actually wasted.
Once you have captured heap dumps, you can upload the captured heap dumps to the free online heap dump analysis tool HeapHero.
Tool will give high level summary of total amount of memory that is wasted, actual data that is causing memory wastage, lines of code that is triggering this memory wastage and recommends solutions to fix the problem.Depending on your application, Heap dumps can contain PII data and other sensitive data. In such circumstance you can register here Heap Dump analysis tool to download and install the HeapHero tool locally in your machine.
Fig: Summary showing how much memory is wasted in total
HeapHero prints a pie graph that summarizes how much memory is wasted due to each inefficient programming practice. Apparently, this application is wasting 35% of its memory. Top two reasons for this wastage are:
a. Inefficient collections (i.e. Data Structures) is causing 11.5% of memory wastage.
b. Duplication of strings is causing 10.4% of memory wastage.
Fig: Memory wasted due to duplicate Strings
In this application there are 343,661 instances of string objects. Out of it, only 144,520 of them are unique. Apparently, there are 6,147 instances of webservices.sabre.com string objects. Why there as to be so many duplicates? Why cant be cleaned and free-up memory?
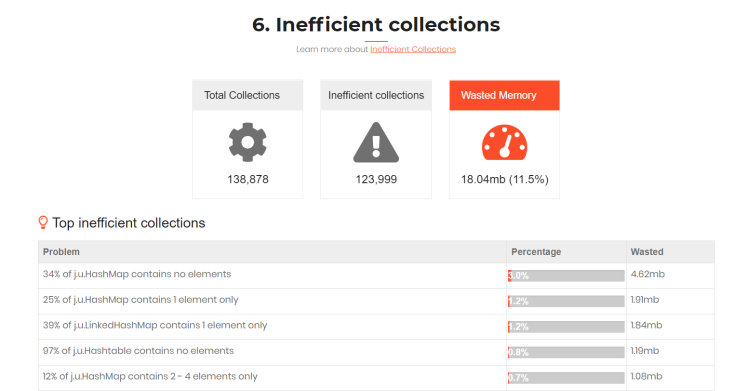
Fig: Memory wasted due to inefficient collections
In this application 34% of HashMap contains no elements. This brings question why so many HashMaps are created with without any elements. When you create a HashMap by default it creates 16 elements. Space allocated for those 16 elements gets wasted, when you dont insert any elements in to it. Even more interesting observation is 97% of Hashtable doesnt contain any elements.
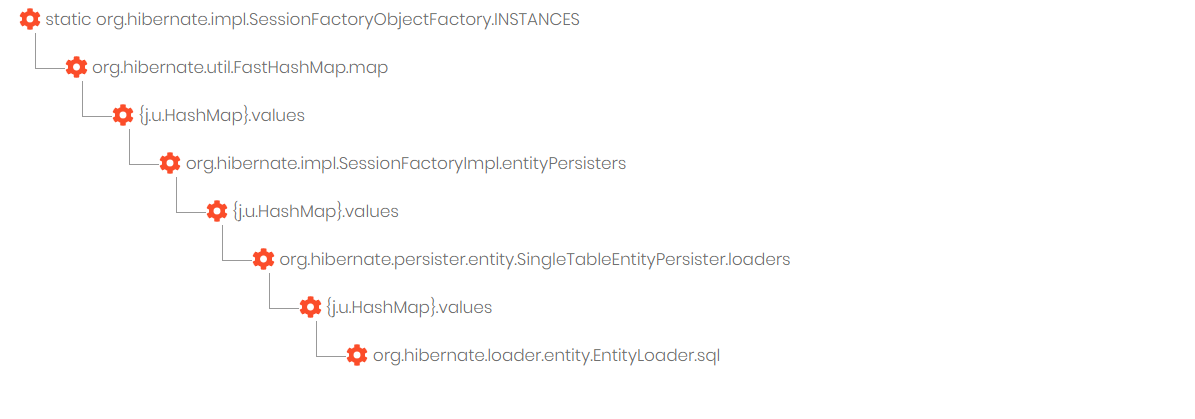
Fig: Lines of code that is originating duplicate Strings
Tool not only shows the objects that are wasting memory, but it also shows the code path that is causing triggering the memory wastage. This will facilitate the engineers to institute right fix in the right part of the application.
Happy hacking, happy coding!


 LinkBack URL
 About LinkBacks


 Reply With Quote