Shenandoah GC aims to reduce pause times in Java applications by performing garbage collection concurrently with the application threads. At the heart of Shenandoahs innovation is its region-based memory management. The heap is strategically divided into regions, allowing garbage collection to be conducted independently on these segments. This not only facilitates efficient parallelism but also contributes to achieving low-latency goals. In this post, we will explore techniques to tune Shenandoah GC for enhanced performance specifically. However, if you want to learn more basics, you may watch this Garbage Collection tuning talk delivered in the JAX London conference.
How to enable Shenandoah GC?
Ensure that your Java version supports Shenandoah GC. Shenandoah is available in OpenJDK starting from version 11. You can also use commercial JDK distributions like Oracle JDK or AdoptOpenJDK. Launch your Java application, with following JVM argument to enable Shenandoah GC:
-XX:+UseShenandoahGC
When to use Shenandoah GC?
You can consider using Shenandoah GC for your application, if you have any one of the requirements:
a. Low-Latency Requirements: Shenandoah GC is an ideal choice for applications that demand consistently low pause times to maintain an optimal user experience. This includes scenarios such as financial systems, online gaming platforms, and real-time communication applications.
b. Large Heap Sizes: In applications with substantial memory footprints, Shenandoah GC excels by minimizing pause times during garbage collection. Examples of such applications include big data processing systems, in-memory databases, and enterprise-level systems with extensive datasets.
c. Predictable Response Times: Shenandoah GC proves valuable in situations where unpredictable and lengthy pauses are unacceptable, and maintaining predictable response times is crucial. This is particularly relevant for interactive web applications where user interactions should result in immediate responses.
d. Dynamic Workloads: Well-suited for applications experiencing fluctuating workloads, Shenandoah GC adapts to dynamic garbage collection requirements. This includes scalable web services and applications with varying user activity throughout the day.
e. Highly Concurrent Applications: In multi-threaded applications with a high degree of concurrency, where traditional garbage collectors might struggle to keep up, Shenandoah GC provides an effective solution. This is relevant for concurrent data processing systems and parallel computing applications.
Shenandoah GC tuning parameters
In this section lets review important Shenandoah GC tuning parameters that you can configure to your application.
-XX:+AlwaysPreTouch
-XX:+AlwaysPreTouch is a JVM argument that ensures committing heap pages into memory upfront. Enabling this option (-XX:+AlwaysPreTouch) ensures that memory is committed upfront, minimizing interruptions during application execution.
-Xms and -Xmx
-Xms sets the initial heap size when the Java Virtual Machine (JVM) starts, and -Xmx sets the maximum heap size that the JVM can use. Setting both values to be the same value, ensures a fixed and non-resizable heap size. This configuration reduces hiccups associated with heap management, providing stability and predictable memory usage for your application. You may refer to this article to learn the detailed benefits of setting initial and maximum heap size to the same value
-XX:+UseLargePages and -XX:+UseTransparentHugePages
Utilizing large pages significantly improves performance, especially on large heaps. There are two options to enable large pages:
-XX:+UseLargePages: Activates support for larger memory pages on Linux or Windows (with appropriate privileges).
-XX:+UseTransparentHugePages: Enables transparent support for large pages. It is recommended to adjust system settings, specifically /sys/kernel/mm/transparent_hugepage/enabled and /sys/kernel/mm/transparent_hugepage/defrag, to madvise. When using this option alongside AlwaysPreTouch, the system handles defragmentation costs upfront at startup.
-XX:+UseNUMA
NUMA (Non-Uniform Memory Access), is a computer memory design that provides separate memory access to each processor, enhancing performance on multi-socket systems. It can be enabled by passing -XX:+UseNUMA JVM argument. This argument is recommended for Shenandoah GC, particularly on multi-socket hosts. This option, coupled with AlwaysPreTouch, can provide better overall performance compared to the default configuration.
-XX:-UseBiasedLocking
For latency-sensitive applications, consider improving performance by turning off biased locking using the JVM argument -XX:-UseBiasedLocking. This option is beneficial because it reduces uncontended (biased) locking, thereby reducing potential delays in your applications execution.
Shenandoah Modes
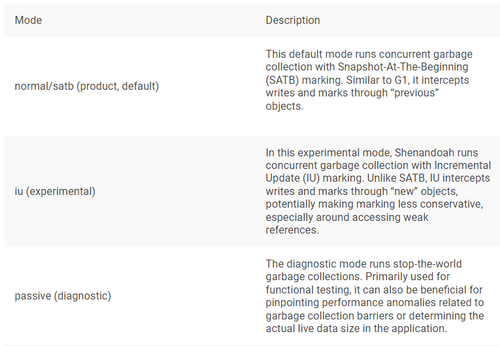
Shenandoah GC performance is controlled by the mode in which its launched. You can select the Shenandoah GC mode through the -XX:ShenandoahGCMode=<name> JVM argument. Below are the available Shenandoah modes:
Shenandoah Heuristics
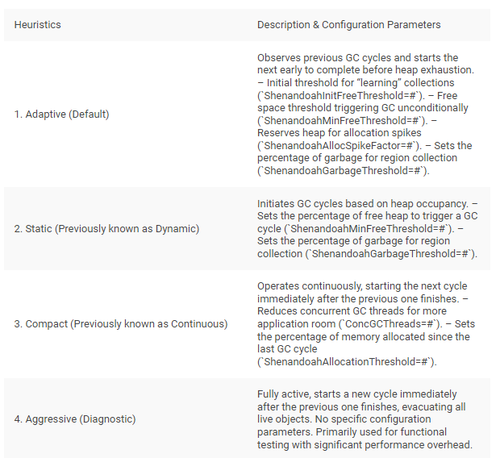
Once youve chosen how Shenandoah GC should run (the mode), the next key factor is how it decides when to start cleaning up (GC cycle) and which parts of memory to clear out (evacuate). These decisions are handled by heuristics, and you can pick the right one using the -XX:ShenandoahGCHeuristics=<name> setting. Some heuristics can be adjusted with extra settings to fit your needs better. Lets look at the available heuristics:
Shenandoah Failure Modes
Shenandoah, like other smart garbage collectors, needs to be faster at cleaning up garbage than the application is at creating new objects. But what if the application is making more objects than what Shenandoah could keep up with? Shenandoah has a backup plan to handle such situations in the sequence mentioned below..
1. Pacing (-XX:+ShenandoahPacing, enabled by default)
When Shenandoah GC is running, it knows how much GC work needs to be done, and how much free space is available for application. Pacer would try to stall the application threads when the GC progress is not fast enough. In normal conditions, GC collects faster than application allocates, and pacer naturally does not stall. Note that pacing introduces the local per-thread latency that is not visible in usual profiling tools. This is why the stalls are not indefinite, and they are bounded by -XX:ShenandoahPacingMaxDelay=#ms. After max delay expires, the allocation would happen anyway. Most of the time, mild allocation spikes are absorbed by the pacer. When allocation pressure is very high, pacer would not be able to cope, and the degradation moves to the next step. Pacing induced latency will be <10 ms
2. Degenerated GC (-XX:+ShenandoahDegeneratedGC, enabled by default)
If an application runs into allocation failure, then Shenandoah would dive into stop-the-world pause, stop the entire application, and continue the cycle under the pause. Degenerated GC continues the in-progress concurrent cycle under stop-the-world. In many cases, allocation failure happens after a significant amount of GC work is already done, and a small part of GC work needs to be completed. This is why the STW pause is not usually large. It would be reported as GC pause in the GC log, all the usual monitoring and heartbeat threads: indeed, one of the reasons to induce STW pause is to make concurrent mode failures clearly observable. Degenerated GC may happen if the GC cycle started too late, or if a very significant allocation spike had occurred. The Degenerated cycle might be faster than the concurrent one, because it does not contend with the application over the resources, and it uses -XXParallelGCThreads, not -XX:ConcGCThreads for thread pool sizing. Degenerated GC induced latency will be <100 ms, but can be more, depending on the degeneration point.
3. Full GC
If nothing helped, for example, when Degenerated GC had not freed up enough memory, Full GC cycle would happen, and compact the heap to the max. Certain scenarios, like the unusually fragmented heap coupled with implementation performance bugs and overlooks, would be fixed only by Full GC. This last-ditch GC guarantees that the application would not fail with OutOfMemoryError, if at least some memory is available. Full GC induced latency will be >100 ms, but can be more, especially on a very occupied heap
Studying Shenandoah GC behavior
Studying the performance characteristics of Shenandoah GC is best achieved by analyzing the GC log. The GC log contains detailed information about garbage collection events, memory usage, and other relevant metrics. There are several tools available that can assist in analyzing the GC log, such as GCeasy, IBM GC & Memory visualizer, HP Jmeter, Google Garbage cat. By using these tools, you can visualize memory allocation patterns, identify potential bottlenecks, and assess the efficiency of garbage collection. This allows for informed decision-making when fine-tuning Shenandoah GC for optimal performance.
Conclusion
In the dynamic landscape of Java garbage collection, Shenandoah offers a balance between low-latency performance and efficient memory management. With its versatile modes, heuristics, and proactive mechanisms like Pacing and Degenerated GC, Shenandoah offers developers a tool to fine-tune garbage collection to suit their applications unique demands.


 LinkBack URL
 About LinkBacks


 Reply With Quote